The cost of selling to new customers is five times higher than selling to existing consumers.
While expanding your customer base is essential, maintaining relationships with your current consumers is far more profitable to your business over time. In fact, a 5% increase in customer retention rates can boost revenue by 25% to 95% (Bain & Company).
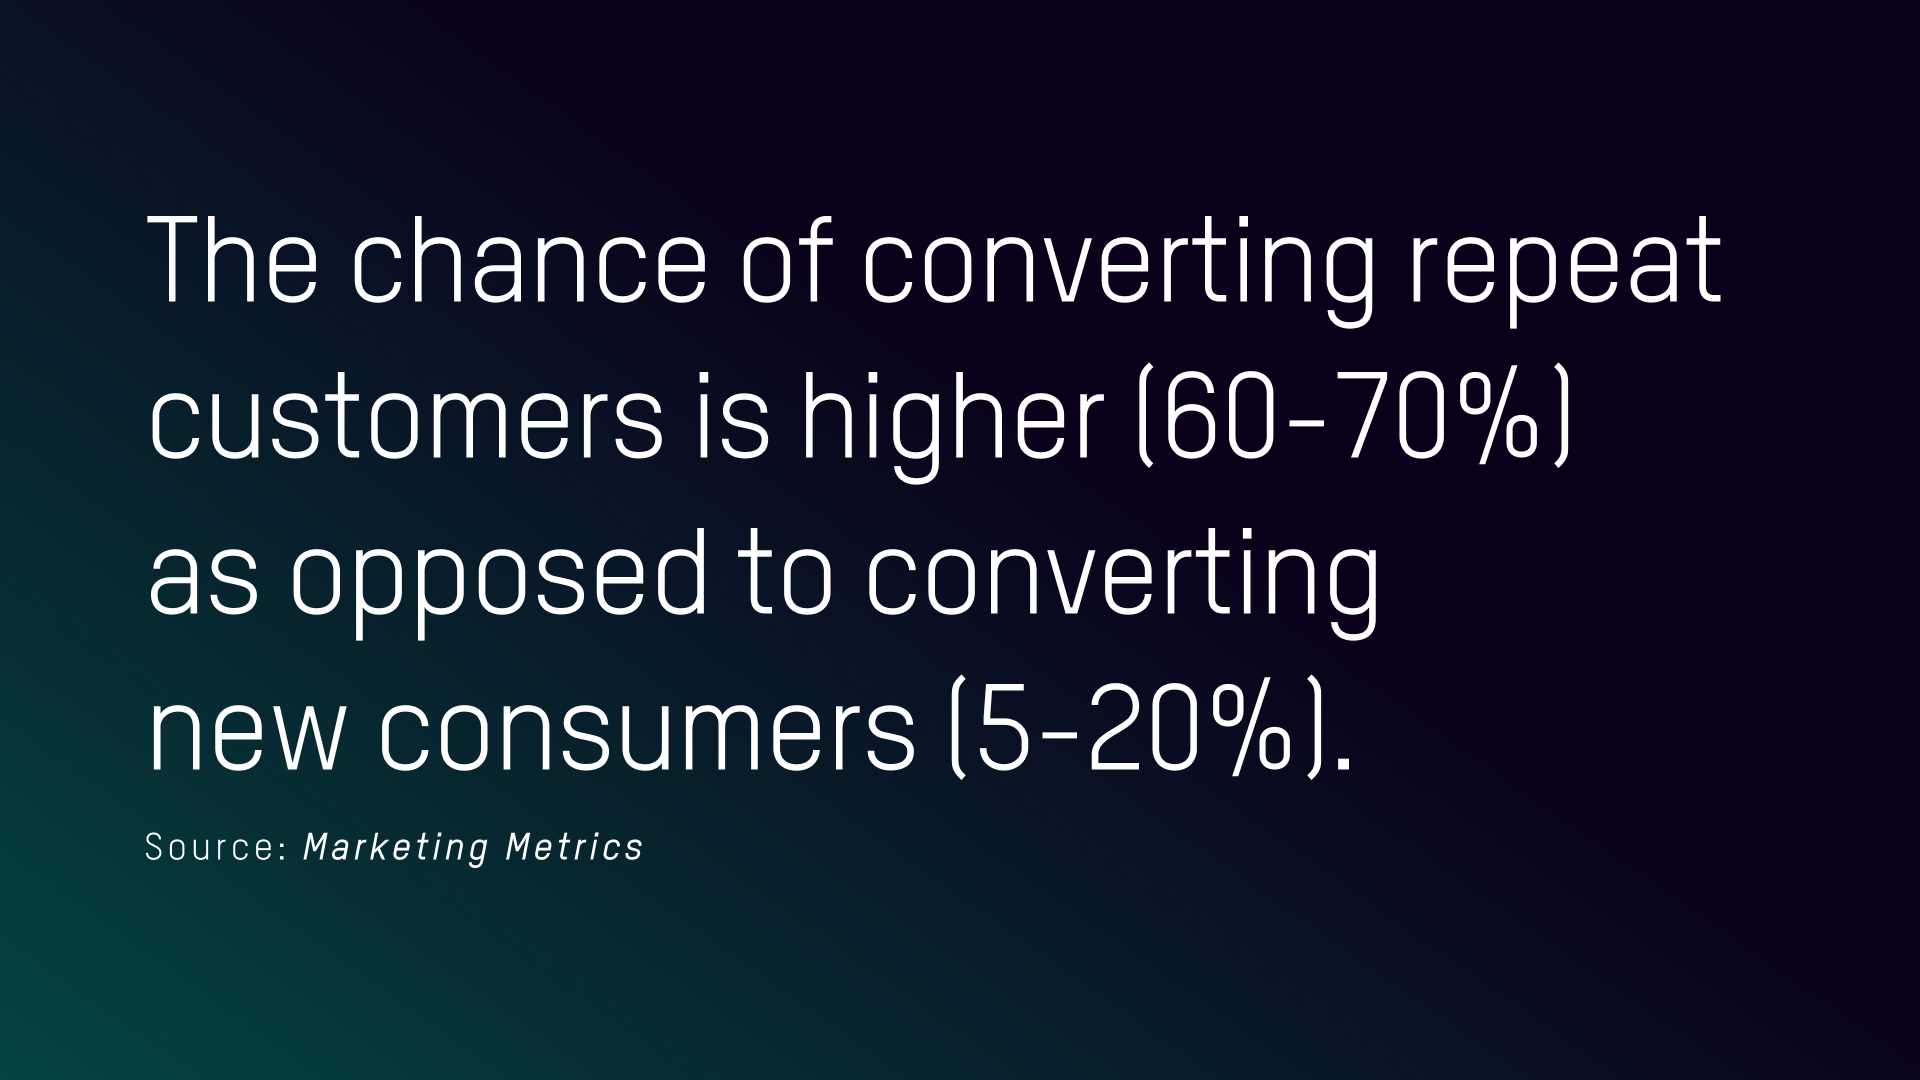
Why? Existing customers are more easily swayed to purchase again once they find a brand they trust. They’re also likely to spend more than first-time buyers. According to Marketing Metrics, the chance of converting repeat customers is higher (60-70%) as opposed to converting new consumers (5-20%).
Focusing on nurturing customer relationships can bring in more conversions and revenue for companies. But to create a strong customer retention strategy, you must first understand how your customers behave—particularly what makes them stay and what drives them away. And the best method for uncovering this type of information is through the use of cohort analysis.
What is Cohort Analysis?
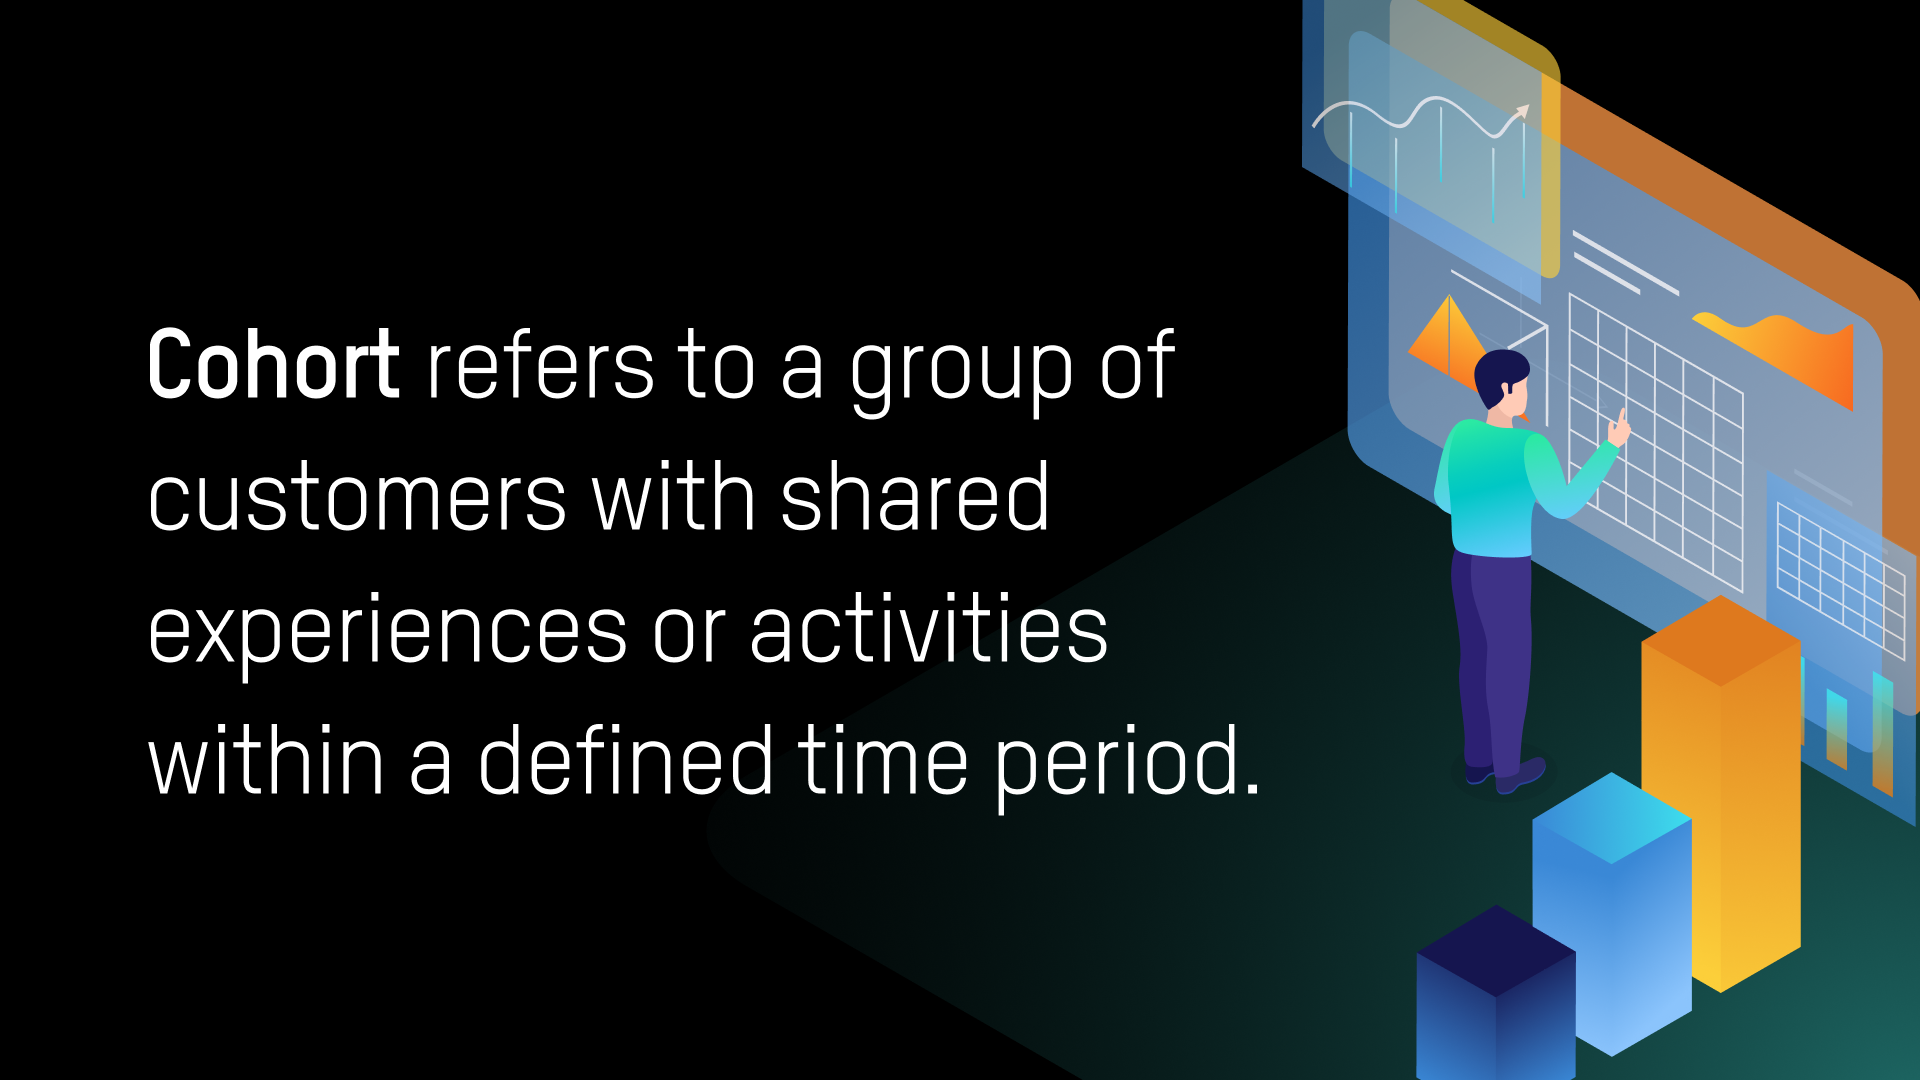
Cohort analysis is the practice of tracking how your cohorts behave over a specific period of time. It helps you compare groups of customers at the same stage of their buying cycle to uncover pain points in their user experience or detect patterns and trends in their purchasing behavior.
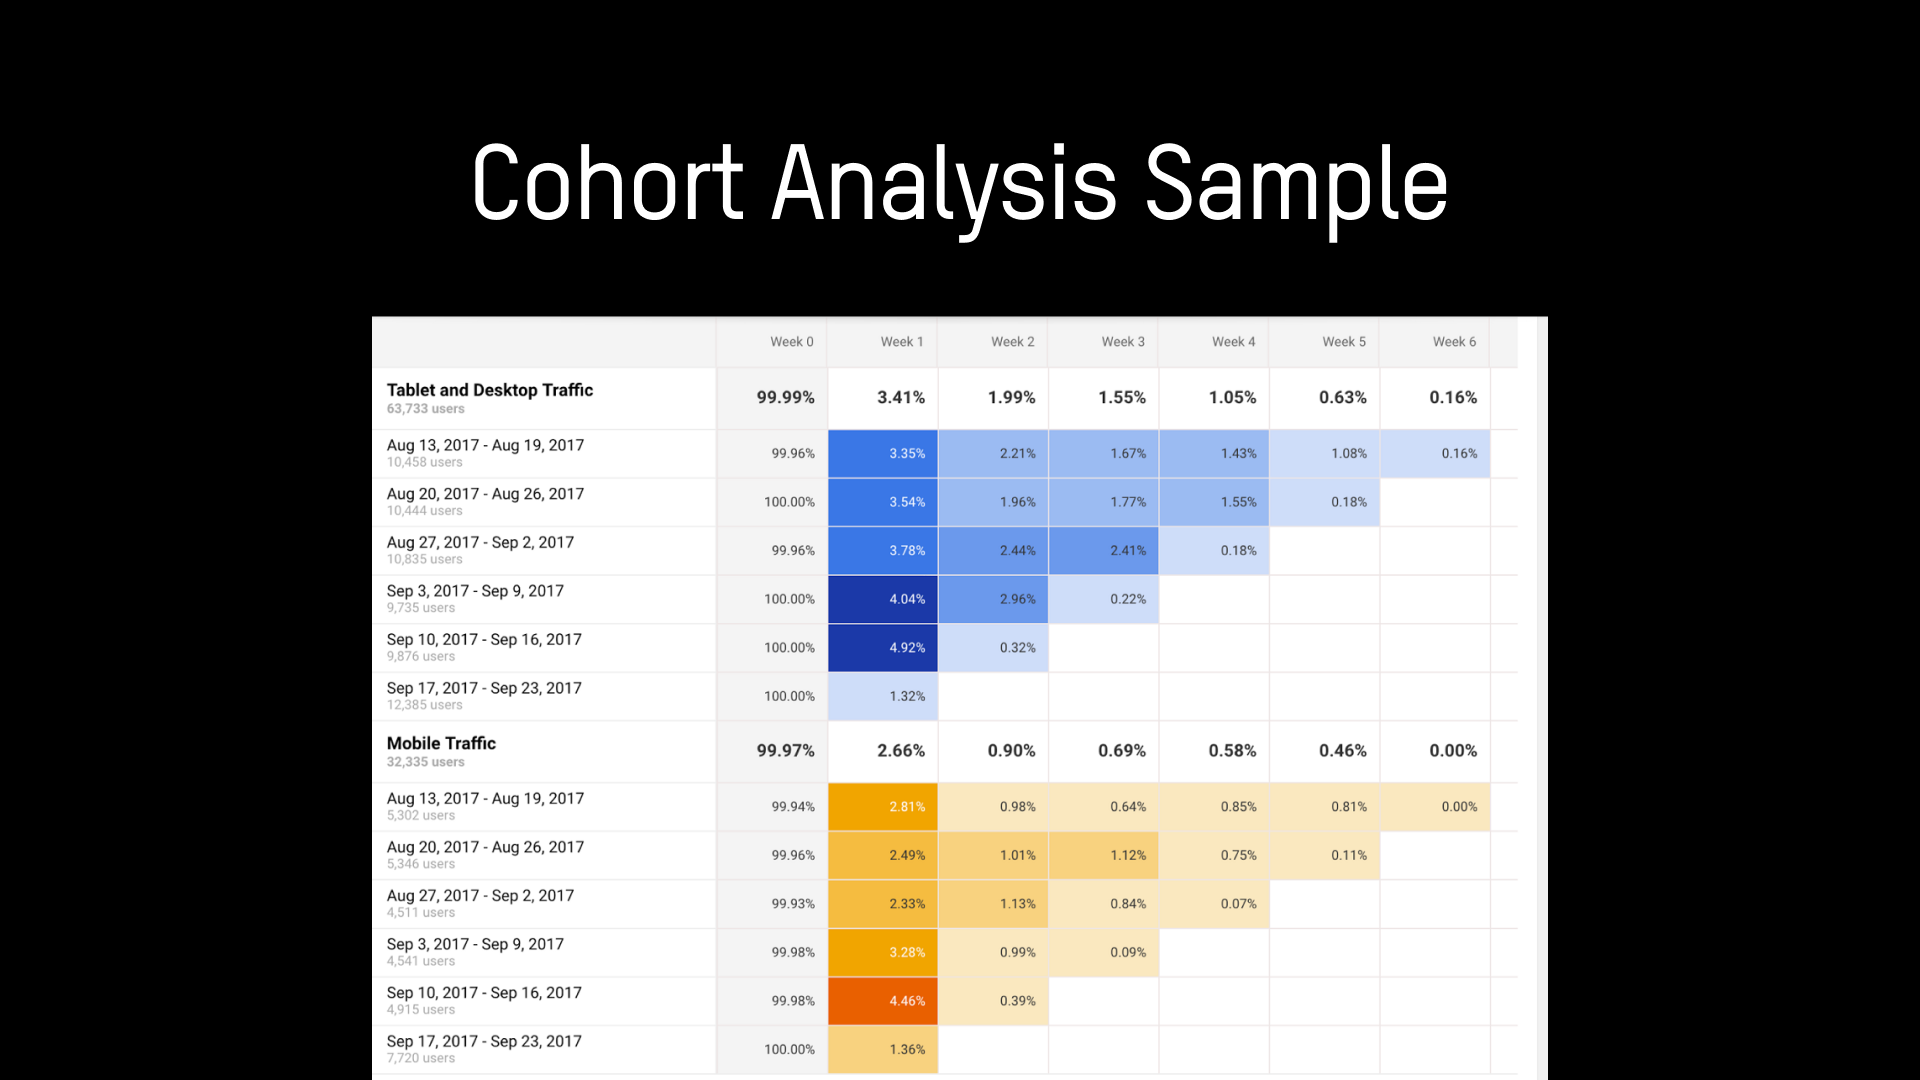
Cohort analysis is commonly used in industries like e-commerce, product development, digital marketing, and online gaming.
What are the Common Types of Cohorts?
There are 2 types of cohorts in cohort analysis: acquisition and behavioral.
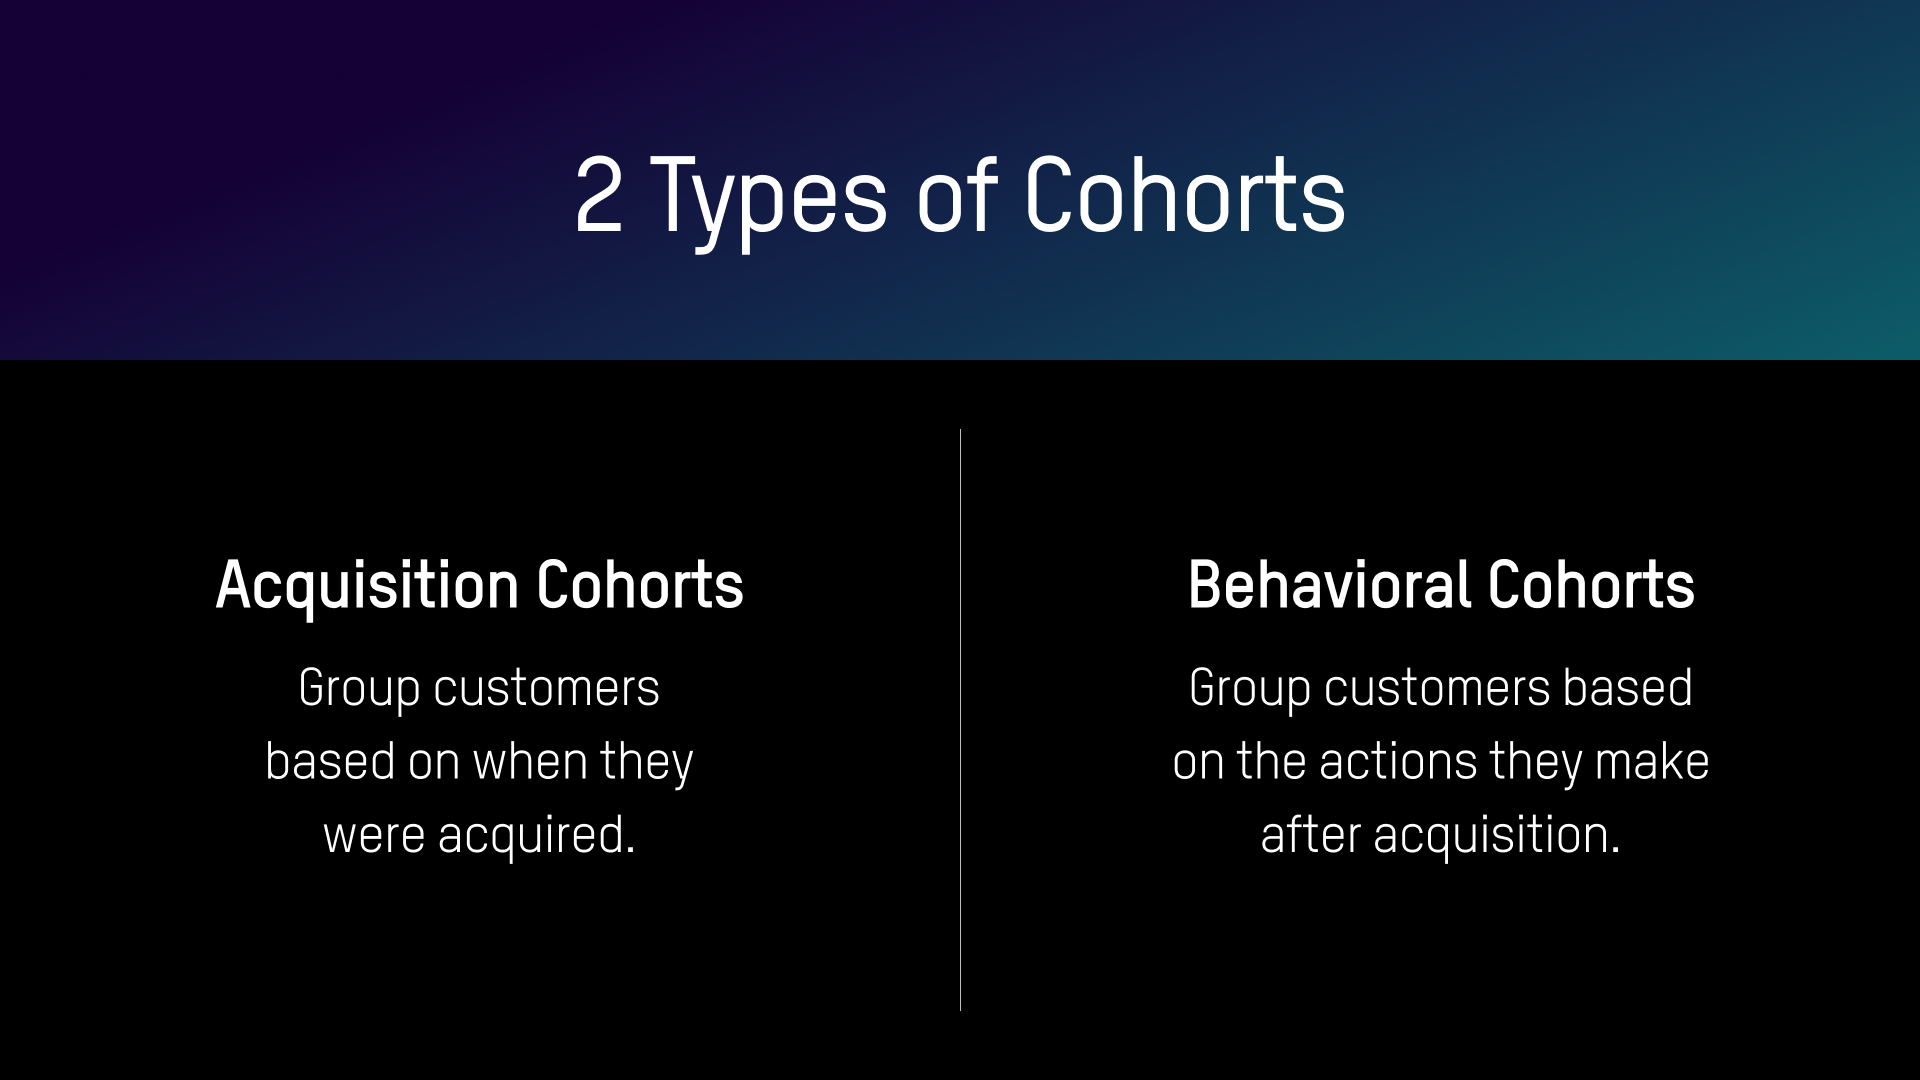
Acquisition cohorts group customers based on when they were acquired. This can be when they install an app, sign up for a product, visit a website, and so on. Depending on your product, this type of cohort can be tracked on a daily, weekly, or monthly basis. Acquisition cohorts let you measure which groups of customers are engaging and disengaging and when they’re churning.
Behavioral cohorts group customers based on the actions they performed after acquisition. This includes using an app feature, abandoning their cart, bouncing off a web page, or uninstalling an app. Basically, behavioral cohorts help you answer the question of why they engage and why they leave. The time period for monitoring this type of cohort depends on your product.
Why Use Cohort Analysis?
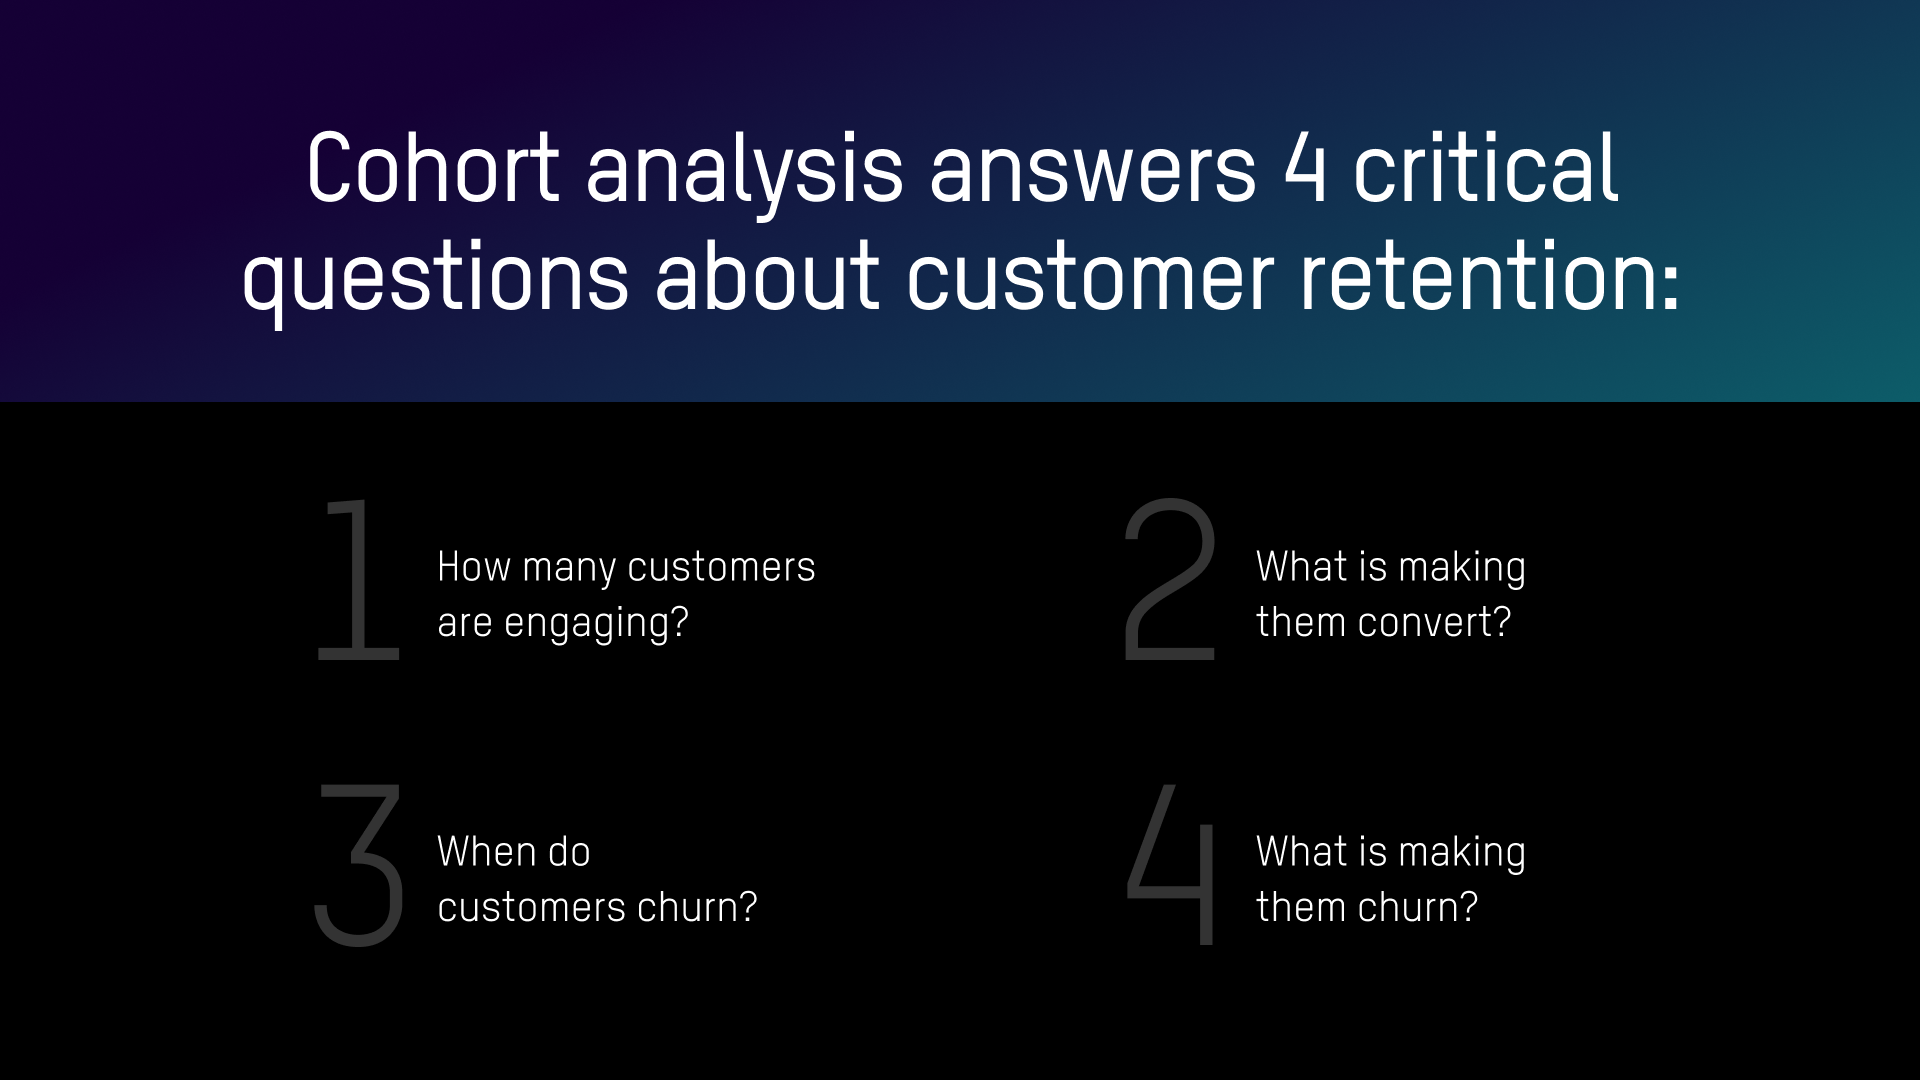
How many people are purchasing your product on a monthly basis? Why are customers disengaging right before checkout? What’s causing consumers to repurchase? All these questions can be answered through cohort analysis.
Cohort analysis enables you to see how your cohorts are engaging with your brand over time. You get to see how long your average customer stays with you, as well as when they disengage from your brand, which allows you to pinpoint areas in your product or campaign that need to be refined. This helps guide your budget allocation and resource prioritization.
For example, the data show that customers who purchased on January 2022 spent more over the course of six months than those who first purchased on April 2022. This tells you that your campaigns from January to March have been more effective in drumming up conversions and encouraging repeat sales. This insight can also prompt you to evaluate your marketing efforts around April onwards as they have led to a drop in conversions.
Furthermore, it lets you to compare customer retention rates according to each cohort’s customer lifecyle to find patterns and predict consumer behavior. These types of insights allow you to precisely measure how your customers behave across different stages of your product life cycle, helping you make smarter business decisions, reduce churn rates, and nurture customer relationships.
What are Some Tools For Cohort Analysis?
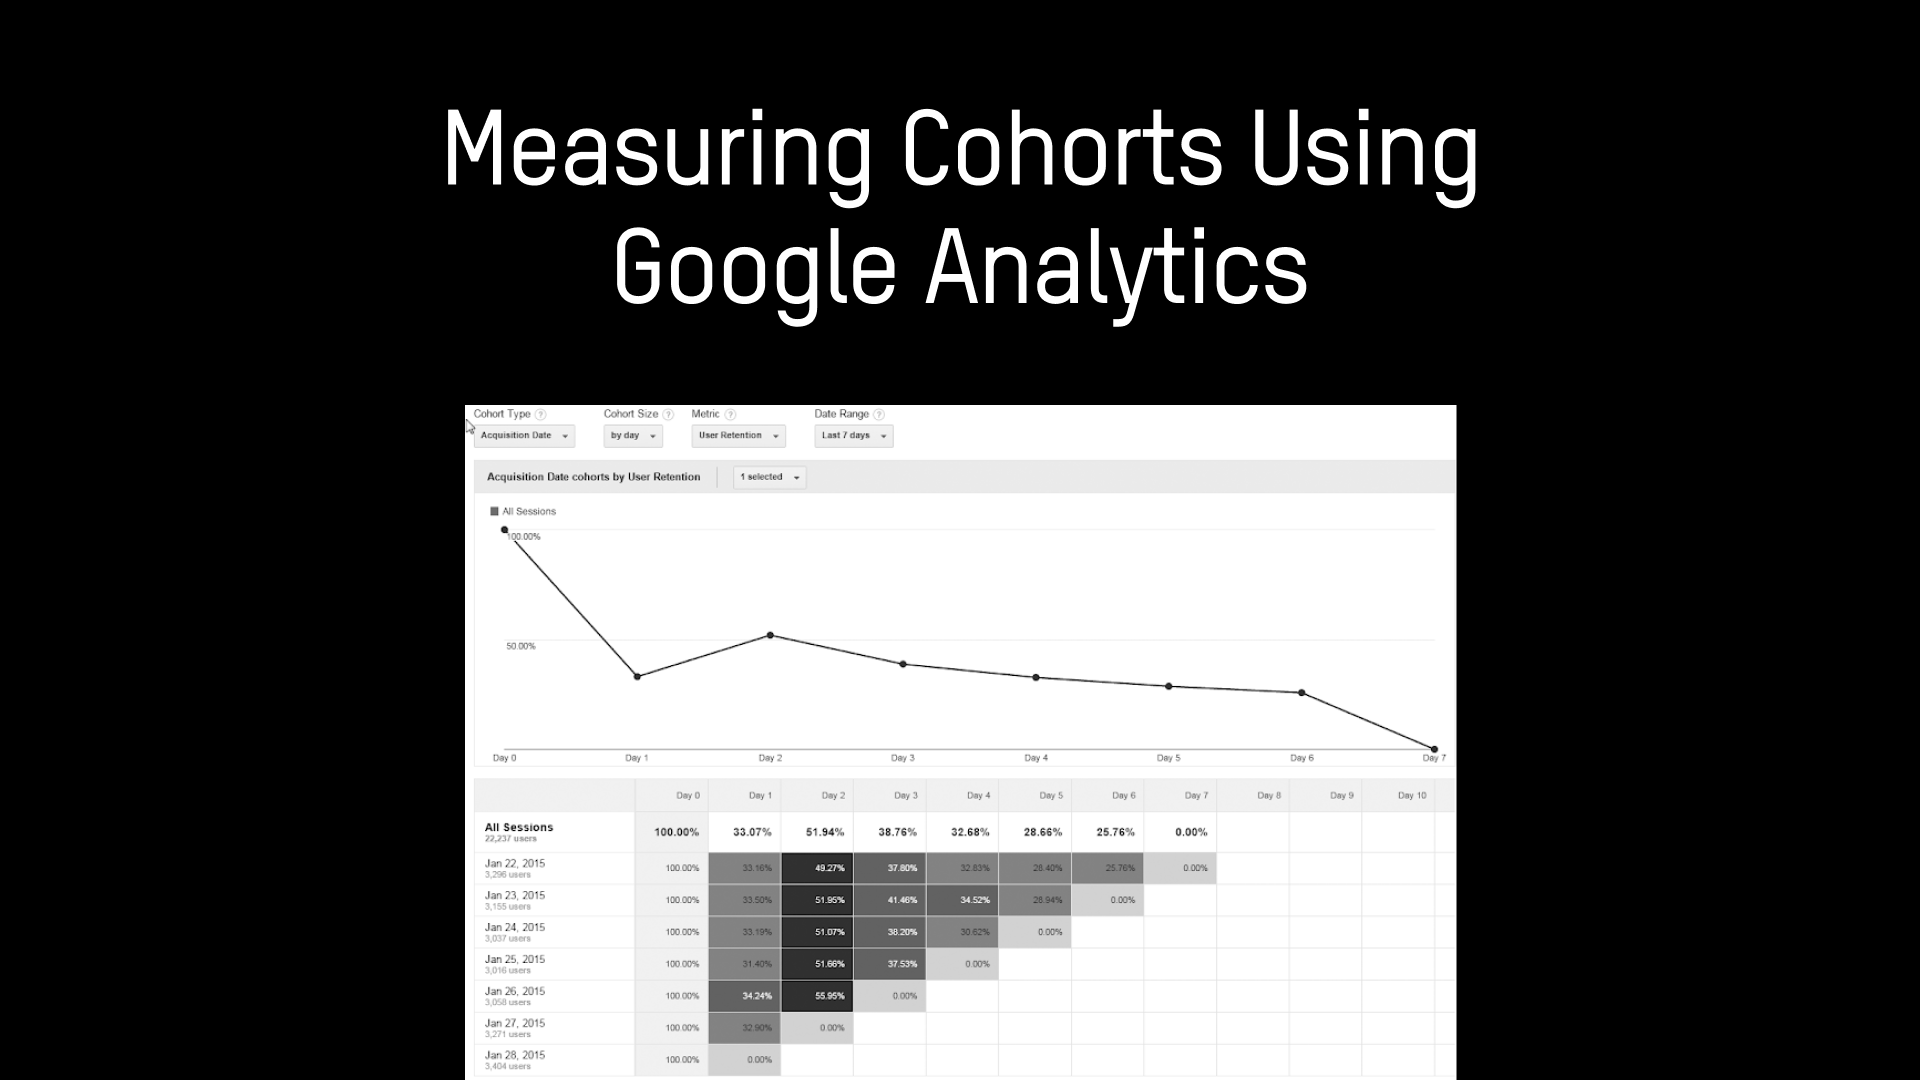
There are various tools that you can use to perform cohort analysis. The most used solution is Google Analytics, a free-to-use tool that boasts comprehensive analytics capabilities. Go to “Audience” and click “Cohort Analysis.” This offers information about your cohorts, from cohort type, cohort size, data range, and other metrics.
Aside from Google Analytics, there are other analytics solutions that provide cohort analysis that show detailed reports of customer engagement and interaction, such as Mixpanel, Amplitude, and Kissmetrics.


