
Google dropped some big news earlier this year—by July 2023, it will start sunsetting its longtime analytics service Universal Analytics (UA).
This announcement puts longtime GA users in a quandary as they’ll be forced to migrate all their properties to Google Analytics 4 (GA4), its latest iteration.
The thing is, GA4 is nothing like UA.
Not only does it boast a new user interface (UI), GA4 also uses a different data measurement model. It will almost certainly offer superior analytics capabilities than its predecessor but its features definitely pose challenges to existing GA users.
So you might be wondering, how different is GA4 from UA? Well, here are the core differences you should know about before making the big switch.
Interactions are quantified differently
One of the main differences between UA and GA4 is how data is quantified.
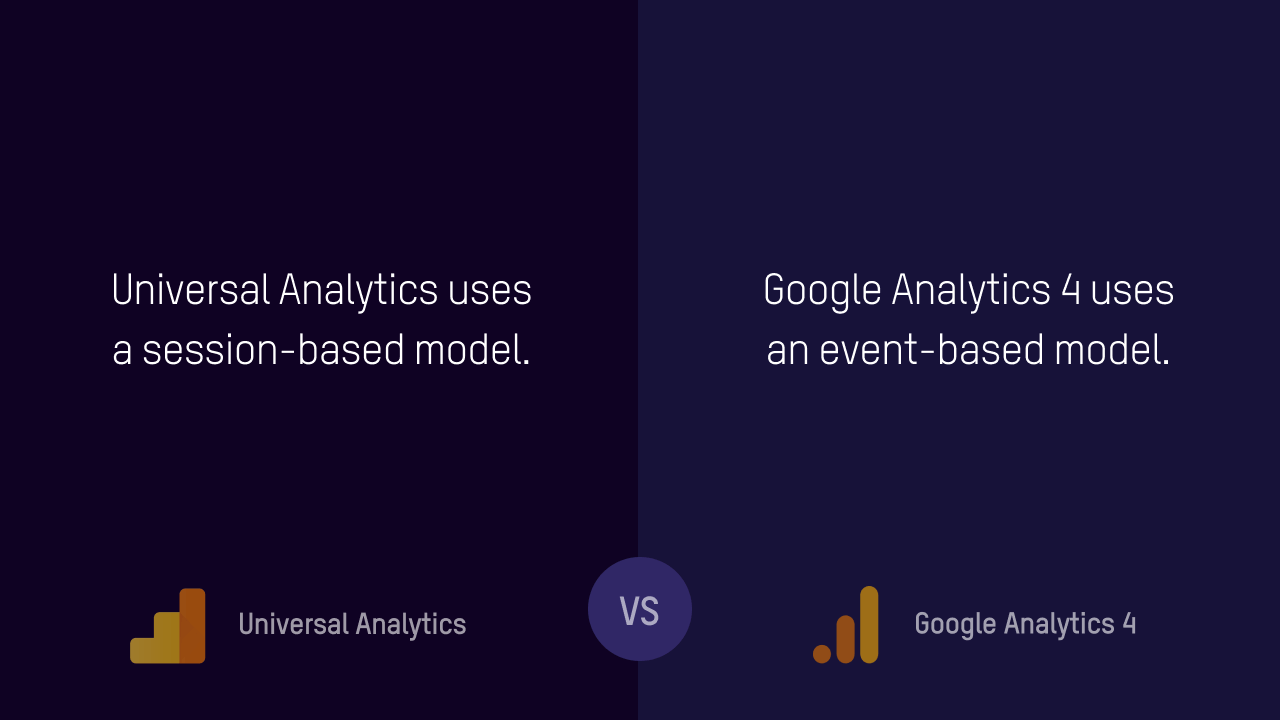
UA uses a session-based model, where user interactions are measured as hits (e.g. pageview hits, event hits, ecommerce hits) and grouped into session—which serve as the foundation of all its reports.
GA4, on the other hand, uses an event-based model. This model quantifies all user interactions as events. It basically eliminates the distinction among hit types in an attempt to simplify the classification of user interactions. So a pageview hit in UA is simply an event in GA4.
What does this mean? Since these two properties collect and analyze data differently, you won’t get the same figures from GA4.
When switching to GA’s latest version, it’s best you start from scratch and take the time to rebuild your data within the property, independent from UA (until you’re ready to let go of it completely).
The concept of data streams
When you log onto GA4, one of the first things you’ll notice is its revamped dashboard.
In UA, you’ll notice its dashboard is a bit convoluted, to say the least. There are a lot of categories that branch out to smaller sections, which some users find a bit confusing.
In GA4, everything’s more streamlined. Its main navigation is simply divided into two sections— Lifestyle and User, which are further broken down into distinct units. This makes it easier for users to find what they’re looking for and hide certain information they find unnecessary to track.
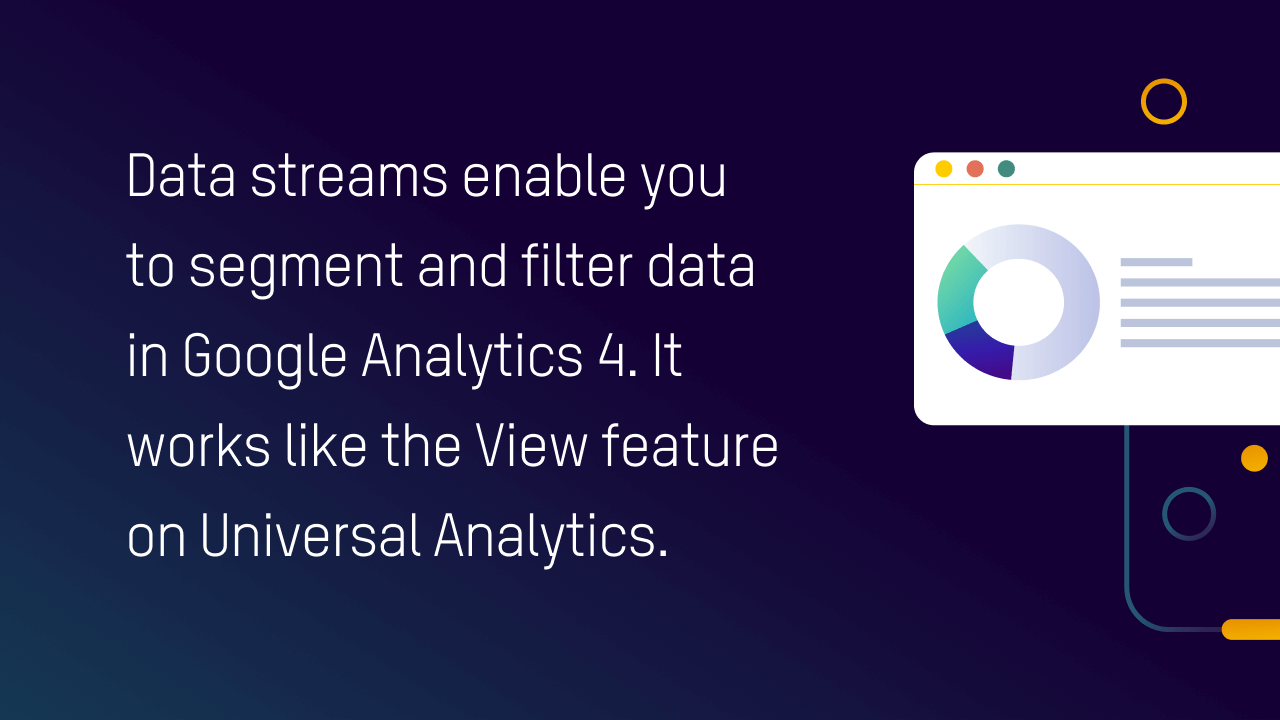
But aside from its simplified navigation, you’ll also notice that the View feature, which allows you to filter data, is nowhere to be found. It’s because this functionality has been integrated into GA4’s main configuration settings through data streams.
Data streams work like View. They let you segment your data within a single property. For instance, if you want to segment your data based on location, you can set up a data stream for each country, making it easier for you to efficiently filter out data.
You have to familiarize yourself with GA4’s structure to uncover functionalities that you find useful in your transition.
Tracking complicated events
If you couldn’t track specific actions within your site before, now you can with GA4.
In UA, to track custom events you had to use Google Tag Manager (GTM) or deploy a custom code on your site.
In GA4, you can monitor specific events based on your own configuration without the use of code.
You can simply go to Configure and choose from a long list of pre-made events (e.g. users adding to cart, users editing payment info, users clicking on a button) that you want to track on your site or app.
But you can also create more complicated events (e.g. users scrolling until the bottom of the webpage, users clicking a specific shoe design) that you want to track on GA.
While some custom events still need the help of GTM, building custom reports can be automatically done within GA4’s property.
The power to curate
Perhaps one of the best things about the GA4 is that it empowers users to curate their own reports.
While it offers ready-made templates to users, GA4 gives you more opportunity to piece together the data you want to see in the platform.
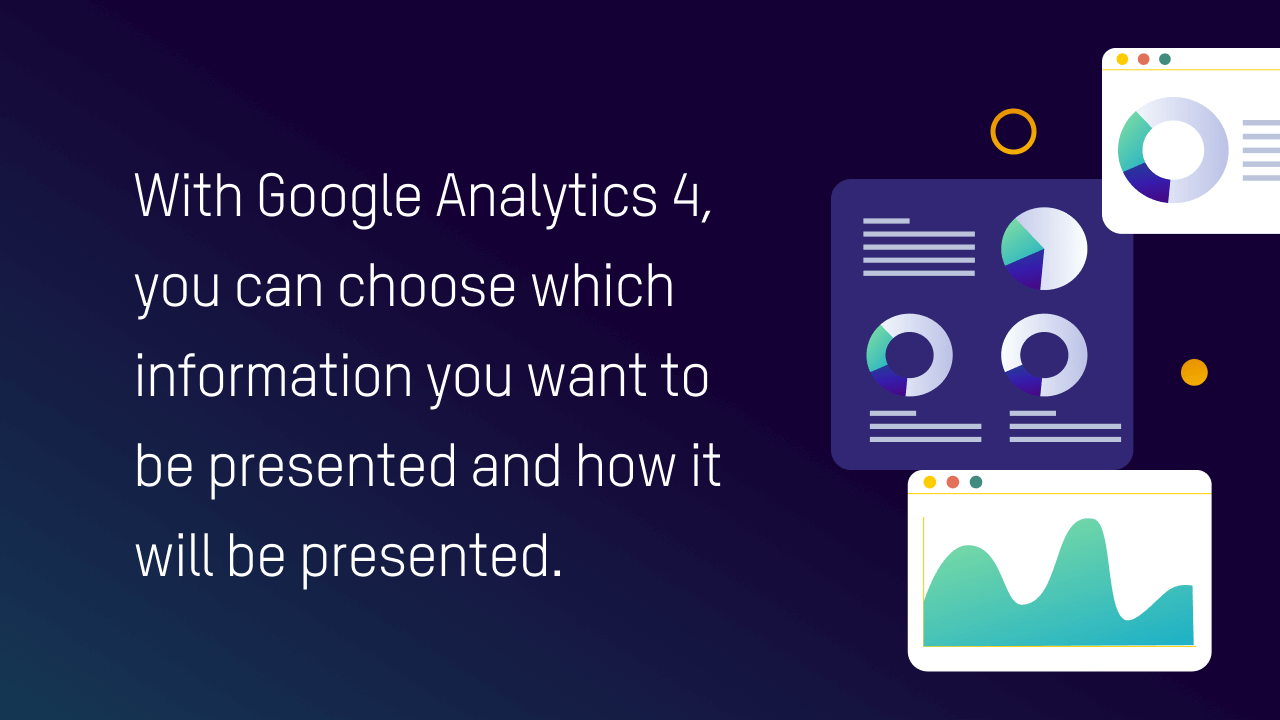
Under Explorations, users can choose how data is presented. GA4 also provides different visualization options (e.g. bar, pie, line chart), depending on your liking.
Aside from that, you can also choose which information is most important to you—and filter out data you find least relevant. Users can even select different variables they want to see, such as segments (subset of users), dimensions (data to analyze), and metrics (data benchmarks) through a simple drag and drop.
Under its GA4’s Reports, you can also select up to 50 custom insights to put at the forefront of your dashboard—letting you keep track of the most important things to your business.


