Data by itself is virtually useless—until it’s converted into actionable insights.
You may be collecting a staggering amount of data but if you don’t know to turn it into useful information, then it’s just a waste of time.
Turning raw data into meaningful insights is critical but not all companies are adept in this area. In fact, most find it challenging to put their collected data under a microscope.
Because of this, the majority of data that companies collect lies dormant. Around 60-70% of their gathered data remains untouched mainly due to their lack of knowledge, time, and resources in data collection and analysis (Forrester).
While it might not seem like a big deal at first glance, the data that goes unused translates into missed opportunities. The smartest move that companies can make is to tap into this rich resource and use it to their advantage.
It might seem complicated, but one of the first things you should learn in generating actionable insights is digging into your data. You must know how to make an accurate interpretation of your gathered data to generate clear insights.

Certainly, knowing how to interpret big data can give you the upper hand in this increasingly competitive market. In fact, organizations that know how to leverage their data are 19 times more likely to increase their profits (Millimetric).
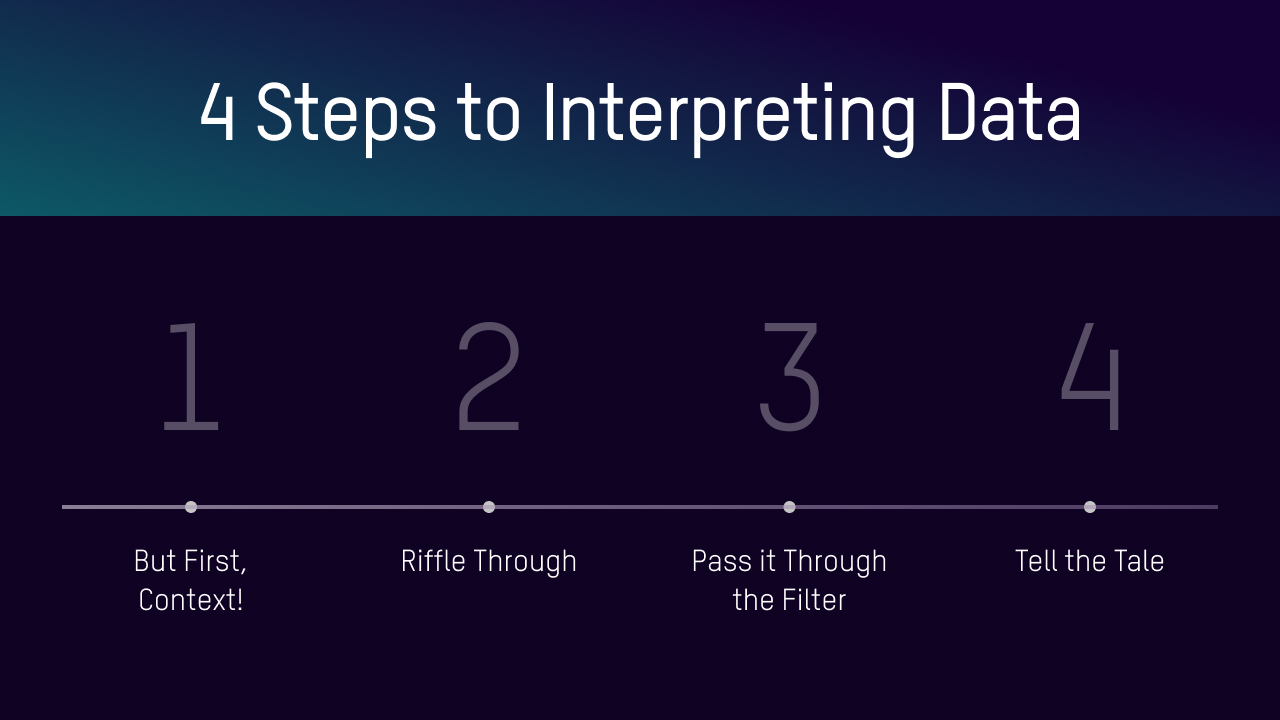
So interpreting data is something that enterprises must master. Here are some simple steps to guide you:

But First, Context!
Before you begin reading into your data, you must first acquaint yourself with the data set you’re about to interpret. By this, we mean, you must identify the source of your data, as well as how it’s formatted.
For instance, how was the data collected? Where did it come from? How was it packaged? Were they all packaged the same? The answers to these questions will give context to your analysis. It will help you better understand your data before you dive deep.
Riffle Through
Take the time to digest the data. Depending on its size and complexity, each data set can take you from 20 minutes to 1 hour (or longer) to review. Go over the data sets before working out a commentary. It’s vital to take notes as you do this. List down your observations. Anything that’s noteworthy, jot it down. This will come in handy when mapping out your written interpretation.
Pass it Through the Filter
The most valuable insights aren’t always apparent at first glance. You have to scratch beneath the surface to get the juiciest information. Oftentimes, the most important insights can be found in the places you least expect. Don’t take data as it is. Don’t be afraid to use filters and dimensions to your advantage to extract relevant data that might be overlooked. You’re likely to unearth something interesting if you dig deeper.
Tell the Tale
Now it’s time to write down your insights. Take note that interpreting is different from narrating. Narrating is merely recapping the statistics. Interpreting is offering a synthesis of the data. When interpreting data, minimize the mention of numerical data in this part and focus on putting your interpretation into words. In addition, your interpretation should always be tied to the collected data. It’s okay to maintain a level of uncertainty in your commentary. It can be written as a conjecture ( “This suggests…”) or with certainty ( “This means…”).


