
How to lower page load time from 1.5 seconds to 1/5 of a second with very little effort
Recently, I had the opportunity to spend some time on improving the speed of a website built on Umbraco. Some of it was the general sort of stuff that tools like Google PageSpeed Insights recommend, such as shuffling script and style files, or adding a bit of caching to static files. However, one major issue was that the HTML itself was taking about 1.5 seconds to load, which is a clear sign that something is off in the Umbraco code, so I decided to dig in. Read on for tips to avoid or get out of the same situation.
History
Umbraco websites can be slow, or they can be fast. This usually has very little to do with Umbraco, and more to do with the developer building the website. The more developers you work with who work on Umbraco websites, the more pitfalls you will experience, and the more you will become aware of the ways to avoid those pitfalls. Some of those pitfalls are so common that they’ve been documented in the main Umbraco documentation website.
I won’t be going over those; rather, I’ll be covering some specific issues I encountered and how to overcome them. Further, I’ll give you tips on how to get the most bang for your buck by quickly narrowing down where the main performance issues reside.
Identifying Slow Pages
Before you even get started with writing code, you should identify the areas that need improvement. The highest level way of doing this would be to use Google Chrome’s network tab to assess the time it takes to download the HTML on your website, as that’ll usually be the main indicator that something is amuck. A good example of that can be found at this URL, which is an Umbraco forum thread I happen to know runs very slowly (likely due to the fact that there are roughly 100 replies to the original message). Using Chrome, I can see that the HTML alone (not including things like CSS, JavaScript, or images) takes nearly 3 seconds to download:
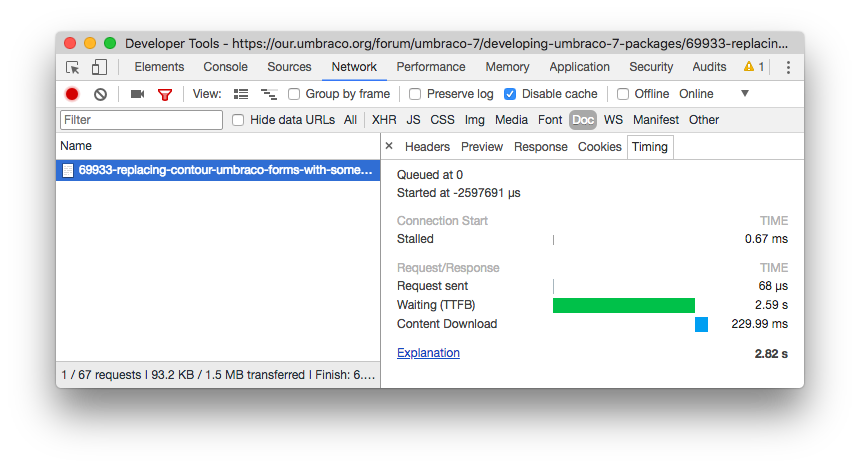
To access this information, open Chrome developer tools, click the “Network” tab, select “Disable cache”, and visit a website, then click on “Doc” to show only the request for the HTML (you may need to click the button to show the filters first), click on the request for your page, then click the “Timing” tab on that request. Here’s what this screenshot tells us:
- Waiting (TTFB) This is the TTFB (time to first byte) for the HTML. Meaning, it took 2.59 seconds just to get the first byte of the HTML for the page.
- Content Download This 229 milliseconds is how long it took to actually download the HTML, after the first byte arrived in the browser.
Since this page is pretty beefy at nearly 100KB, it is to be expected that it would take some time to download the content over the internet. In this case, it took 229 milliseconds to download the content, which is not all that bad. Where things get really interesting is the 2.59 seconds it took just to start to download the content. Depending on a number of factors (internet speed, distance to server, and so on), the best you could expect the TTFB to be would usually be in the range of 100ms to 200ms (maybe 300ms or slower in rare instances, such as when using a cell network). This is basically due to network latency.
If your website is spending more than 200ms doing server-side processing, you should probably focus on improving the speed of your website.
If we subtract 200ms from 2.59 seconds to account for network latency, that still leaves us with 2.4 seconds of time spent retrieving the first byte of the HTML for this page. That essentially means the web server that hosts this website took 2.4 seconds just to construct the page without any sort of network lag. That seems like an awful lot of time just to output a bit of HTML, so this is our first indicator that this page needs a tune up. If your website is spending more than 200ms doing server side processing, you should probably focus on improving the speed of your website.
Why So Sluggish?
Now that you’ve figured out a page is slow, it’s time to dig into the specific areas that are causing the problem. How you’ll do this depends on your website architecture. If most of your logic is in a C# controller, then you’ll focus your efforts there. However, if most of your logic is in CSHTML view files, that’s where you’ll hone in on. In my case, the website I was working on was using the latter approach (logic in the CSHTML view files), so I’ll dive into that.
The difference informed me of roughly how much time each file was taking, which gave me a clear idea of the order in which I’d want to improve each file.
Before you even start digging into your partial views, I recommend focusing on your views and layouts. In my case, I wanted to focus on the homepage, so I had three CSHTML files (the main view for the homepage, an intermediate layout, and the root layout for all pages). I only had a few hours to work on this, so I used a process of elimination to figure out how fast or slow each of those CSHTML files were.
To do this, I used Chrome to track the HTML load time of the entire page, then I compared that against the HTML load time when I commented out each file (save for a few required things that could not be removed without breaking the website). The difference informed me of roughly how much time each file was taking, which gave me a clear idea of order in which I’d want to improve each file.
I also commented out all of the files at once to check if there was any additional overhead that I was not aware of. Once I knew which CSHTML file was the slowest, I began digging into that file to identify areas that could be improved. Some things were very obvious with a quick glance that they needed improvement, such as use of the Descendants() function without any caching. Other areas required a bit more tinkering to figure out if and why they were slow. This was my main tool to help figure that out:
This is a very simple snippet of code that allows you to test the performance of your code. It will tell you the number of milliseconds it took your code to execute. Another Umbraco-centric version of this would be to use the MiniProfiler bundled with Umbraco, which you can read about on the debugging page in the Umbraco documentation. Here's an example of how I used that snippet to measure how long it took to render a particular partial view:
This allowed me to very simply identify a few slow partial views. One that was displaying a simple notification message (basically a title and message) was taking a whopping 300ms all by itself. Luckily, partial views tend to be very small bundles of code that are easy to optimize.
Optimization #1: Optimize Descendants ()
One of the most egregious offenders in terms of slowing the site down was code that calling Descendants(). This is because the code is processing large parts of the site on each page load, potentially dealing with thousands of nodes at a time. Because Umbraco doesn’t deal with instances of IPublishedContent particularly quickly (it’s surprisingly slow), it’s best to take great care when dealing with large numbers of content nodes.
Since I had little time to find optimizations, I came up with one that I could use in many areas across the code base. One of the most common patterns I saw when code was calling Descendants() was that it would get all the descendants, filter them based on some document type, then do a bit of additional processing, and usually it was called relative to just a few specific content nodes (e.g. the homepage, a blog landing page, or something of that sort). Because of that, I created a cached version of Descendants() I called CachedDescendants(). Here you can see its implementation:
One caveat I realized when writing with this code was that some Umbraco functions seemed to perform depth-first searches, while others seemed to be breadth-first, so I had to make sure to write my cached versions in the same way. In other words, you may want to alter this implementation to suit your needs regarding the way you want to traverse the content tree. Here's an example where that function becomes useful:
Now, you’ll only have to traverse the content tree once to find your blog root node, and that root node will be cached for all subsequent visits. You may note that I’m actually caching the ID of the blog root node rather than the IPublishedContent instance. This is because IPublishedContent instances may have information specific to the current request, and so it is not safe to cache across multiple requests.
Another thing you may observe in the above code is that it’s making use of the Rhythm.Caching.Core library. This library is useful for some basic caching functionality, and it has very few dependencies, so it’s very lightweight (since it doesn’t depend on Umbraco, you can use it with any Umbraco version). You can optionally make use of Rhythm.Caching.Umbraco to add some cache invalidation so that your caches are refreshed whenever the content nodes you’re working with change (e.g., they are published, deleted, or moved). Both of these libraries are available on NuGet.
In my case, I was working with an Umbraco 6 project, so I had to port Rhythm.Caching.Umbraco to Umbraco 6 (it was built on Umbraco 7) to create Rhythm.Caching.Umbraco6. That was relatively trivial, as the API’s are largely the same between these two Umbraco versions. Another thing I had to do in order to use these NuGet packages was to upgrade to .Net 4.5.2, as that is the minimum required version for each of them. Again, this was a fairly trivial process (essentially, just set the .Net Framework version on each Visual Studio project in the website solution to be 4.5.2).
Optimization #2: Get Descendants Without Descendants()
Just because you need to get a descendant of a node doesn’t mean you need to actually call the Descendants() function to get it. One trick I use often is to store settings on the homepage node, such as a content picker that allows you to pick a descendant node. Looking up the homepage is usually a fast operation (depending on how you do it). Subsequently getting a picked node from a property on the homepage is also a fast operation. If you need to find a node that is at the root of your blog or a node that is storing your main navigation, just create a content picker for it on the homepage.
Optimization #3: Avoid Dynamic Types
I happened to notice a bit of code was using “Umbraco.Content” rather than “Umbraco.TypedContent”, which means it was returning dynamically typed objects rather than instances of IPublishedContent (technically, it may be returning IPublishedContent under the hood, but you can’t see that since it’s returning a dynamic type). Dynamic types in Umbraco can be a bit slower than strongly typed instances, so it’s usually a better idea to use strong types where possible. This would only save a few tens of milliseconds, but every bit counts.
Optimization #4: Faster GetHomepage()
There was a bit of code that was attempting to get a homepage for a given node (this particular site has multiple domains, each with their own homepage node). Nothing wrong with that, except this code was crawling up all ancestors until it found one with a “Homepage” document type.
For deeper nodes, this could take a fair amount of processing. To speed this up, I avoided crawling up the ancestors and instead extracted the homepage from the “Path” property, which is on every instance of IPublishedContent. The “Path” property stores a comma delimited list of ancestor page ID’s for a given instance of IPublishedContent. The first number in the list is “-1” to represent the root of the content section, and the second one is the ID of the content node at the root of the site.
By splitting that string on commas, I can very quickly get the ID of the homepage node, at which point I can call “Umbraco.TypedContent” to get the IPublishedContent instance for that ID.
This one won’t save a lot of time when called once, but if called enough times the savings will start to add up.
Optimization #5: Single Instance of UmbracoHelper
Much of the code was littered with new UmbracoHelper(UmbracoContext.Current). I’m not entirely sure how much time it takes to create an instance of an UmbracoHelper, but it seems like a pretty hefty object, so I figured creating as few as possible would be ideal. In general, you should make use of the existing instance of UmbracoHelper (e.g., in a CSHTML view, this is typically the “Umbraco” variable), but it’s hard to avoid in certain situations (e.g., some utility functions).
For the instances where I needed to create an instance of UmbracoHelper, I at least cached that instance to avoid creating it over and over. One thing to keep in mind is that you shouldn’t cache this variable forever, as it can change for each web request. For that reason, I cache it in HttpContext.Items:
Optimization #6: Cache Expensive Operations
Sometimes, operations are expensive no matter how you look at it. For example, if you have some need to get every article in your site (e.g., to display in a gallery), that’s going to be an expensive operation. One could use Examine to do some optimization, but that can still be a bit slow as compared to simpler alternatives.
My preference in these situations is to store the bare minimum information in an in-memory cache using the same approach mentioned above with CachedDescendants. Taking the article example, I’ll create a class called “Article” and I’ll store instances of that in a list wrapped with an InstanceCache. You might be inclined to consider storing instances of IPublishedContent in a cache, but that’s just begging for problems.
For one, the internals of that have changed over time and may change yet again, so by caching an instance of IPublishedContent, you may be causing a WeakReference to an old clone of the content cache to remain undisposed, leading to memory steadily building up. This is more of a hypothetical concern (I don’t actually know if IPublishedContent instances store anything like a cloned content cache), but it’s worth keeping in mind to code defensively.
Additionally, operations against IPublishedContent instances can be slow (e.g., GetPropertyValue). I find it best to simply map instances of IPublishedContent to instances of my own class, such as Article. Here's an example of how I'll store articles to a cache.
It’s an expensive operation to populate this cache up front, but I only need to incur that penalty as often as I want. For a site in which content doesn’t change often, I’ll cache for a long time, but allow a cache invalidator to invalidate the cache whenever content does get updated. For a site in which content does change often (e.g., when there are dozens or hundreds of content editors), I’ll cache for a shorter time, but will not make use of cache invalidation.
Optimization #7: Don’t Optimize
There are right ways to optimize and there are wrong ways to optimize. One subpar way I’ve been guilty of in the past is to optimize the cache by using an ASP.NET MVC feature known as output caching (or donut output caching, which is like output caching with bits of the page that aren’t cached).
That can be a workable solution for a site with lots of speed issues, as it’ll provide a very cheap way to provide a speedup to users. The downside is that each page must be visited at least once in order for that cache to populate for those pages. In fact, the default is to require two page visits before a page will be cached.
The first problem this causes is that there may need to be hundreds of page visits required before the cache is populated. The second problem is that it’s much harder to make more dynamic components, such as a component that displays a user’s name.
The type of caching I have been mentioning in this article is referred to as application level caching. This type of caching occurs within your application and is more targeted than general approaches like output caching. The main benefit is that you can cache things after a single page visit, and every page now benefits from that cache population (i.e., rather than requiring every page to incur a cache population penalty, only a single page must incur that penalty).
The effect of choosing application level caching over techniques like output caching is that you can incur a couple seconds of slowness a few times a day rather than hundreds of instances of those couple seconds of slowness. That is a dramatic improvement. On top of that, you can invalidate those application level caches only when necessary, whereas invalidating an output cache is more shotgun.
Optimized Optimization Advice
If you’re one of those people who skips straight to the end of an article to get the condensed version of the advice (guilty!), here it is in listicle form:
- Avoid Descendants() You can use picked nodes instead, or add some caching.
- Skip Dynamics Use strongly typed classes instead.
- Faster Lookups Find faster ways of looking up content nodes, such as by using at the “Path” property to get the node you’re looking for quickly.
- Fewer Instantiations Don’t create a bunch of instances of UmbracoHelper when you only need one per request.
- Application Level Caching Cache anything that you expect to take more than a few milliseconds and that can be used across many pages. Make sure to cache objects that support fast operations (i.e., avoid IPublishedContent).
- Skip Output Caching Don’t rely on output caching as your main caching approach.
Follow that list and your pages will load in a fraction of a second.


